Page 58 - Kolte Patil AR 2019-20
P. 58

India’s real estate market  Market size (US$ billion)

                        1500
                                                                                      1,000
                        1000
                                                            650
                         500
                                 120
                          0
                                2017                       2025                       2030
                                                                                                 (Source: IBEF)
                                                   MIG-I                        MIG-II
             Annual household income limit         Between C6,00,001 up to C12,00,000  Between C12,00,001 up to
                                                                                C18,00,000
             Dwelling unit carpet area             160 sq. mt                   200 sq. mt
             Eligible loan amount for interest subsidy (C)  9 Lakh              12 Lakh
             Interest subsidy                      4%                           3%
             Maximum loan tenure (in years)        20                           20
             NPV subsidy                           C2.35 Lakh                   C2.30 Lakh

            1 sq mt = 10.7639 sq ft
            (Source: Economic Times)

             Key geographies

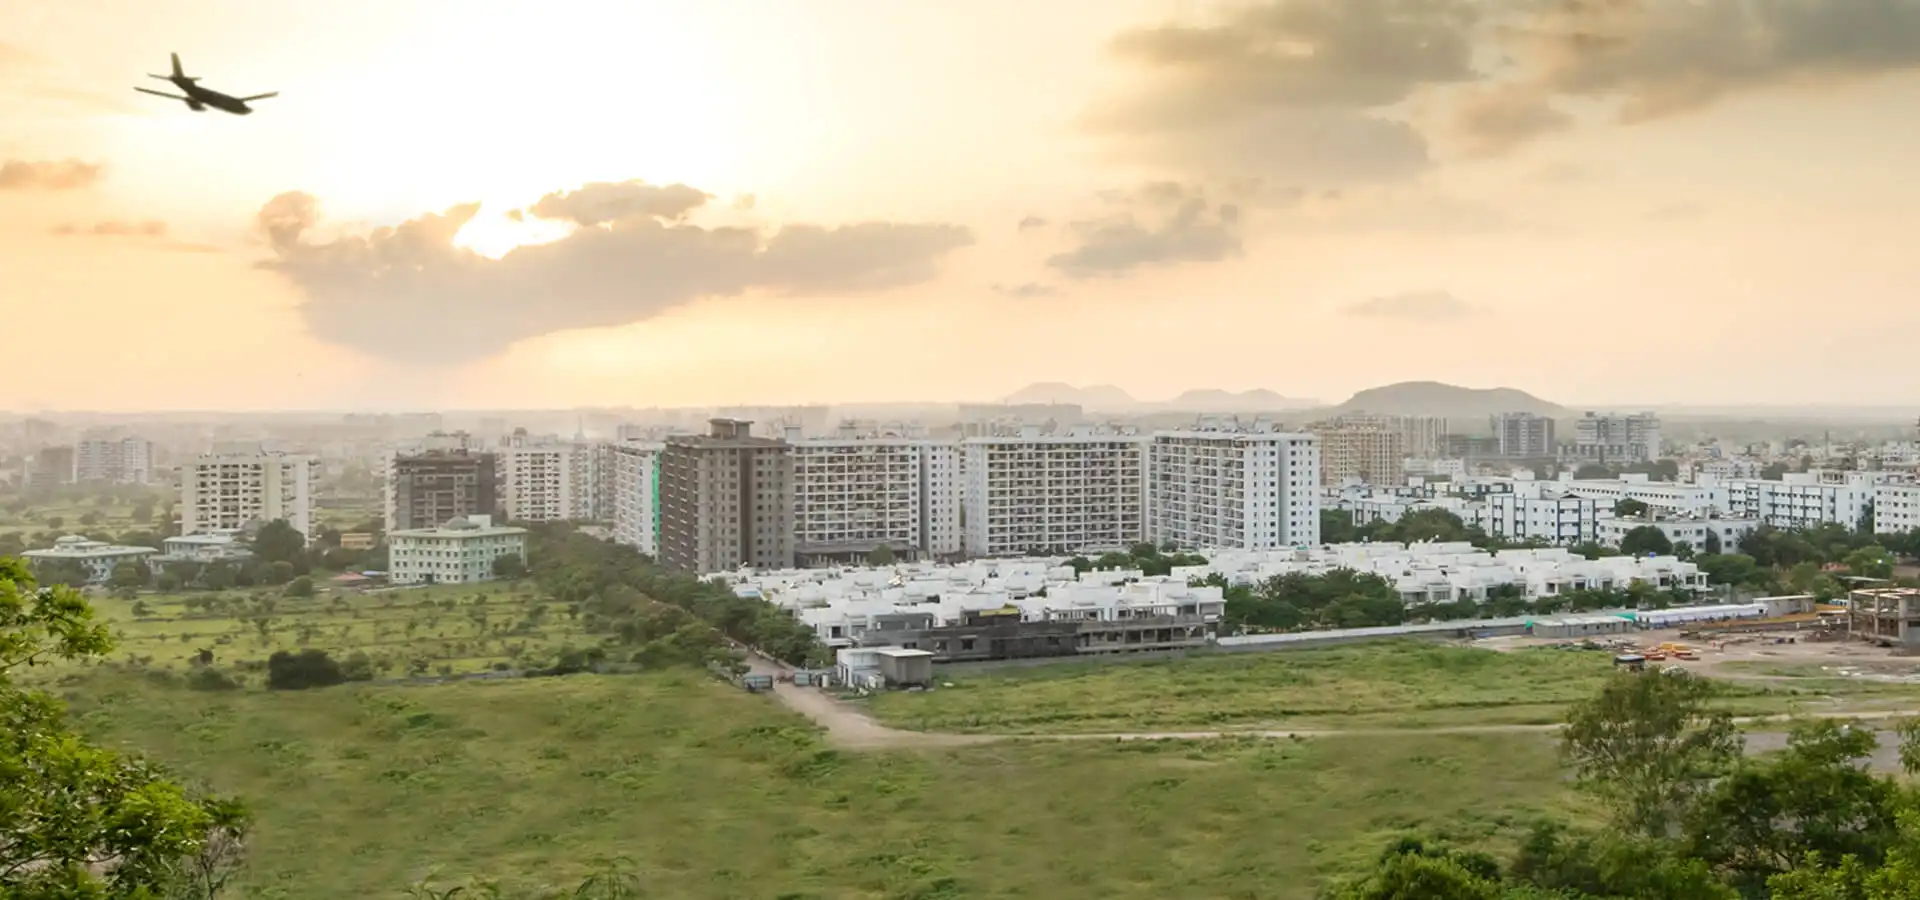
            Pune: Pune is one of the fastest   in 2018 to 0.58 million square metres   for both. In the suburbs, the FSI for
            growing cities in the Asia-Pacific   in 2019. However, the average price   residential projects increased to 2.5
            region. Pune has one of the best urban   of commercial real estate in the city   from 2.0 and for commercial projects
            infrastructures in India, ranked No. 1   saw an increase of 5% y-o-y. (Source:   was at 5.0 as against 2.5. (Source:
            in the Ease of Living Index 2018 by the   Economic Times, Financial Express,   Economic Times, Financial Express)
            Ministry of Housing and Urban Affairs   JLL report)               Bengaluru: Bengaluru accounted for
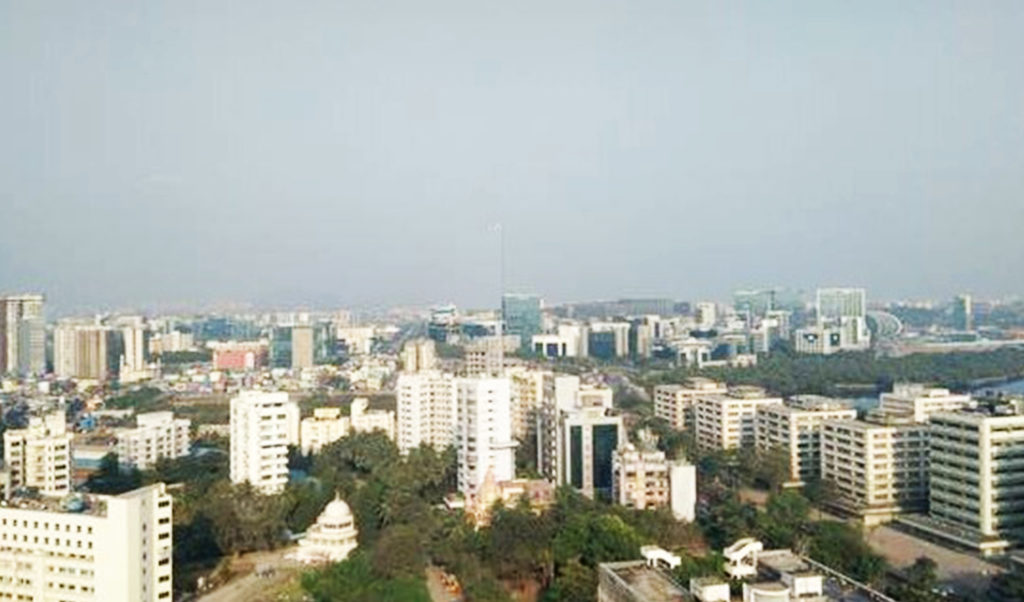
            in India. The city also ranked highest   Mumbai: Mumbai is the largest luxury   45% of the total projects launched in
            amongst all Indian cities in Mercer’s   residential real estate market in India.   2019 (for those towering above G+20
            21st Annual Quality of Living Rankings   The Mumbai Metropolitan Region   floors). However, Bengaluru witnessed
            in 2019. Pune ranks sixth in terms of   (MMR) recorded 22% year-on-year   a 12% drop in residential sales to
            city per capita income in India. IT,   (y-o-y) growth in sales to 80,869 units   50,450 units in 2019 from 57,540 units
            Education, Automobile, Manufacturing   in 2019, the highest since 2013. The   in 2018. Bengaluru witnessed a price
            sectors amongst others are the key   number of new units launched in CY19   gap of around 5% – under construction
            drivers of Pune’s real estate growth.   was at its highest since 2016 at 77,990   homes cost C4,820 per sq.ft. on average
            India’s Smart Cities Mission, gives   units. The unsold inventory declined   and ready to move in homes realised
            impetus to the growth of Pune’s urban   marginally by 1% to 2.16 Lakh units in   C5,050 per sq. ft on average. Bengaluru
            infrastructure. The city is likely to   the region; this could take 33 months   dominated the office space market with
            witness investments worth more than   to clear. Of the total 1,816 housing   15.6 million sq ft absorption in 2019,
            INR 650 billion over the next 7-8 years   projects launched during the year under  a year-on-year (YoY) growth of 15.4%.
            for the construction of metro rail links, a   review across India’s seven leading   The city’s office space is mainly driven
            new airport terminal and a ring road.
                                             cities, over 52% were high-rises with   by IT, ITES and co-working providers.
            The city saw 37% y-o-y growth in   ground plus 20 floors structure. Mumbai  Bengaluru would witness additional
            its new launches in the residential   Metropolitan Region (MMR) accounted   15 million sq ft of office space in the
            segment from 32,684 units in 2018   for more than 75% of the total 734   next three years. The proposed FSI
            to 44,660 units in 2019. However, the   project launched in 2019 in the high-  ranges from 2 to 5, depending on the
            sales of residential real estate de-grew   rise category. The region absorbed 6.9   size of the plot and the road and seeks
            2% in 2019. Further, average prices   million sq ft of office space, an annual   to encourage vertical growth and wider
            also de-grew by 3% in 2019. On the   increase of 11.3% in 2019.   open spaces in the form of setback
            commercial front, the city saw a decline   In MMR, the current average price of   areas. With this, properties along the
            of 41% y-o-y in new launches of office   under construction homes was C10,075   metro, suburban and bus corridors will
            space from 0.64 million square metres   per sq ft while ready-to-move properties   benefit from the new policy. (Source:
            in 2018 to 0.38 million square metres in   were priced at C10,460 per sq. ft. The   Economic Times, the Hindu Business
            2019. Further, the sale of office space   residential FSI for MMR has been raised   Line)
            in the city recorded de-growth of 5%   to 3.0 and commercial to 5.0 from 1.3
            y-o-y from 0.61 million square metres

            56 | Kolte-Patil Developers Limited
   53   54   55   56   57   58   59   60   61   62   63