X


![]()
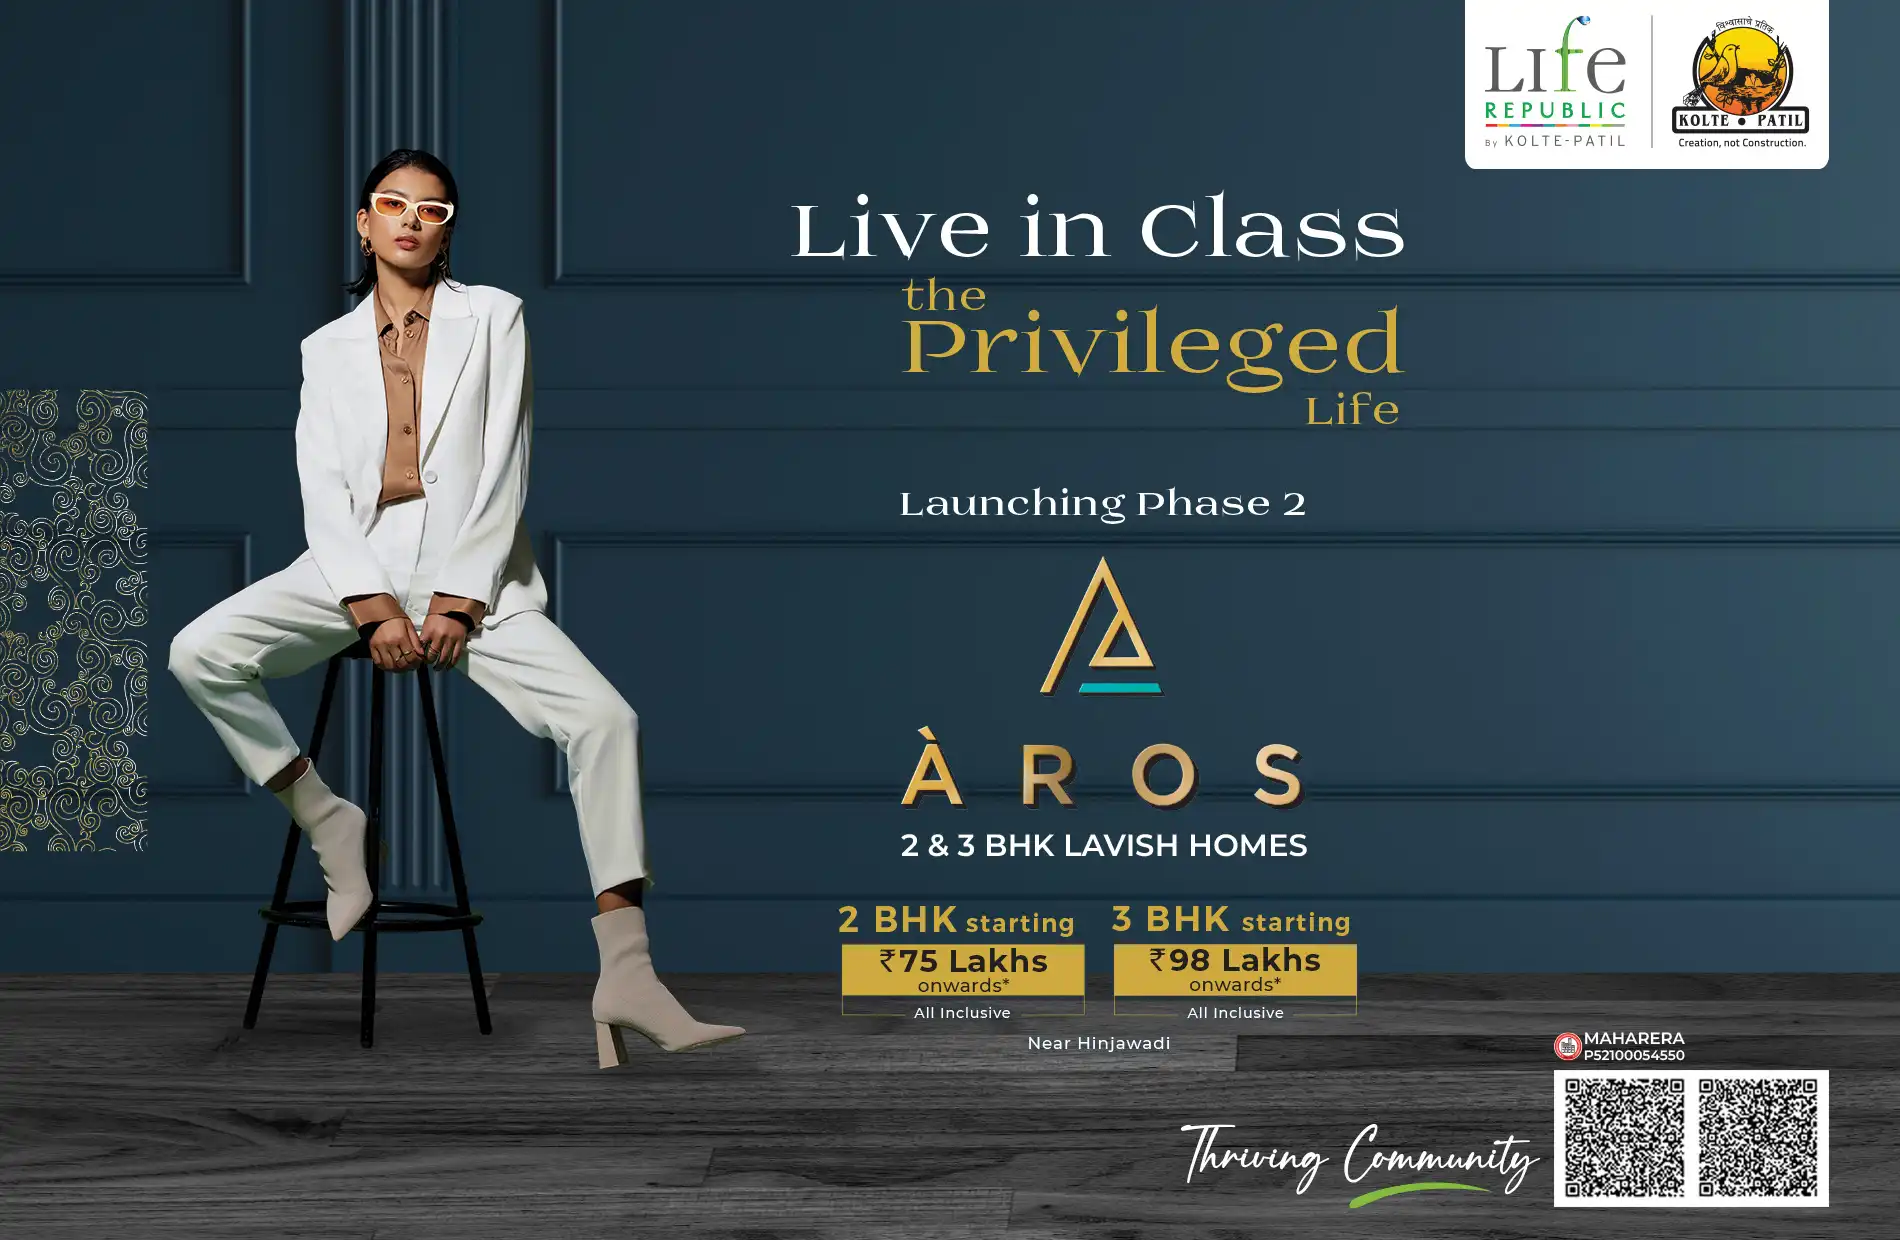
Location
Configuration
Price Range
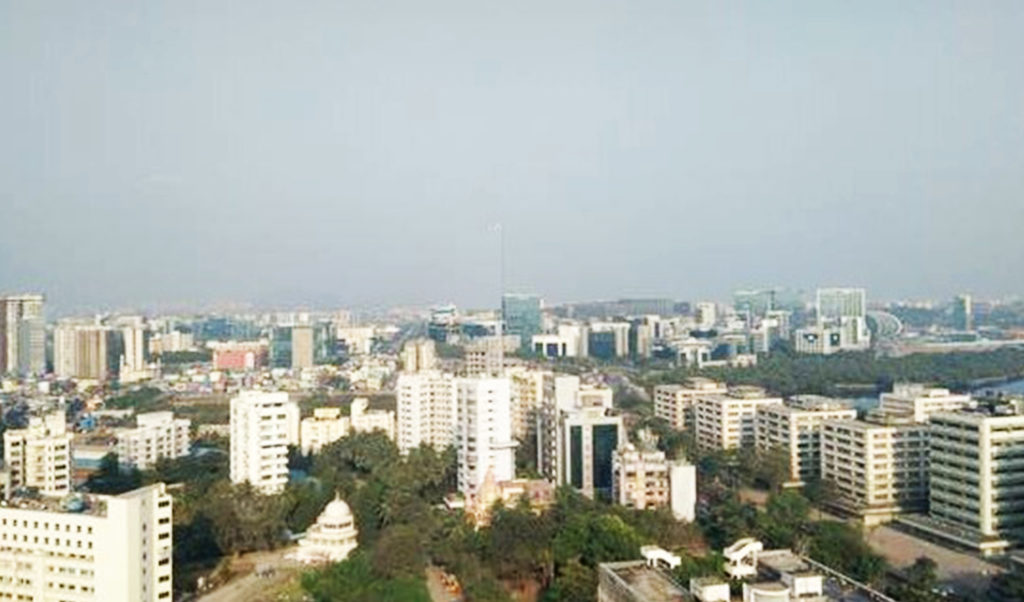
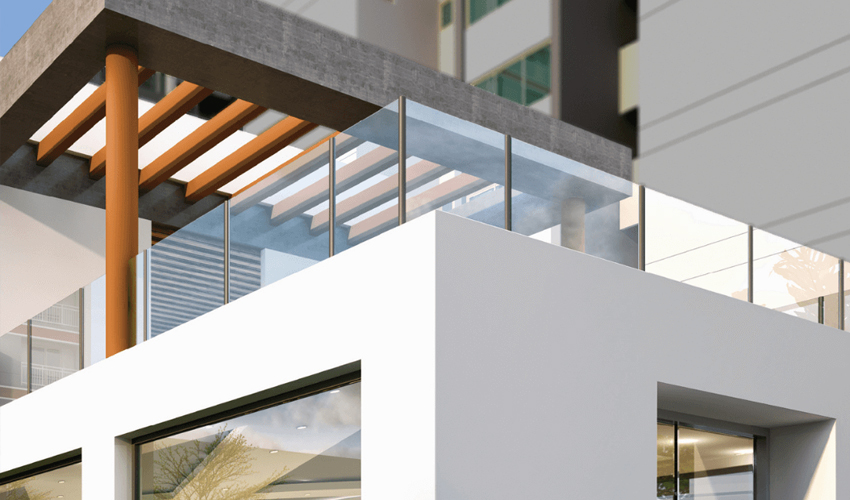
Explore our future-ready Anti-Fragile spaces

Did you
Know?
Statistics say that nearly one-third of the senior citizens tend to slip and fall in the bathroom at least once a year.
Know MoreAnti-Skid Tiles,
For a secure today.

creating
landmarks for
3 Decades
philosophy of
Creation,
not construction
2 crore
square feet
of development
REAL ESTATE DEVELOPER WITH A MANUFACTURING & SERVICES MINDSET,
DELIVERING SUSTAINABLE & PROGRESSIVE SPACES FOR A BRIGHTER TOMORROW
ACROSS THE COUNTRY.
Awards & recognition
Our aim is not only to become the top most real estate developer but also to create real estate projects that offer our residents a brighter tomorrow. A life where they don’t just live, but create wondrous memories. At Kolte-Patil Developers, we just follow our instincts and quest for excellence in everything we do. The awards and accolades won so far stand testimony to this approach.
Listed below are some of the prestigious titles won by us in the past years:
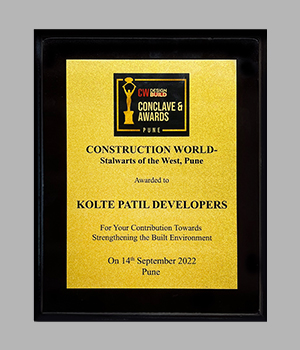
Construction World - Stalwarts of the West, Pune - September 2022

Asia Pacific Property Awards Winner Residential Property India - 24Kstargaze - 2022-2023

Residential High Rise Architecture India- 2021- 24K Opula

Luxury Project of the Year 2021 - Centria
Media Coverages
Stay updated with the latest media headlines, official announcements, achievements, press releases, newest trends in the real estate industry and additional information on Kolte Patil Developers.


Press Releases
At Kolte-Patil Developers, we understand how crucial it is to keep our audience aware of our various developments. So, whenever we have a new project coming up or an event taking place, we make sure we share the news via press releases.
Here’s a list of press releases from events that took place over the past few years:
 On 25th May 2023
On 10th May 2023
On 6th February 2023
On 25th May 2023
On 10th May 2023
On 6th February 2023